
Ethereum price Drops to $1,700 and Bounces 25%
- Analysis
- May 15, 2022
After the Ethereum price reached the price target at around $ 1,700, it bounced strongly on the support and rose around 25%.
“The Ethereum price could now correct to 1,800 USD. Ethereum could form a floor between $1,600 – $1,950. So if Ethereum breaks the support between $2,150 – $2,300, it may find its bottom between $1,600 – $1,950. This price level is a hot candidate for the Ethereum price to put an end to the correction. Because at this price level, the ETH price will most likely bounce very strongly.”
But back in September 2021, we warned about this scenario and implied a possible turning point at $ 1,700. But also throughout 2022, we repeatedly emphasized the significance of the support between 1,600 – 1,950 USD and, not least in January, drew attention to a possible decline to around 1,800 USD:
“But if Ethereum breaks through $ 2,800, it will most likely correct to the golden Ratio at around $ 1,800, which Ethereum could bounce off very strongly.”
Ethereum price Bounces to price level of $1,700
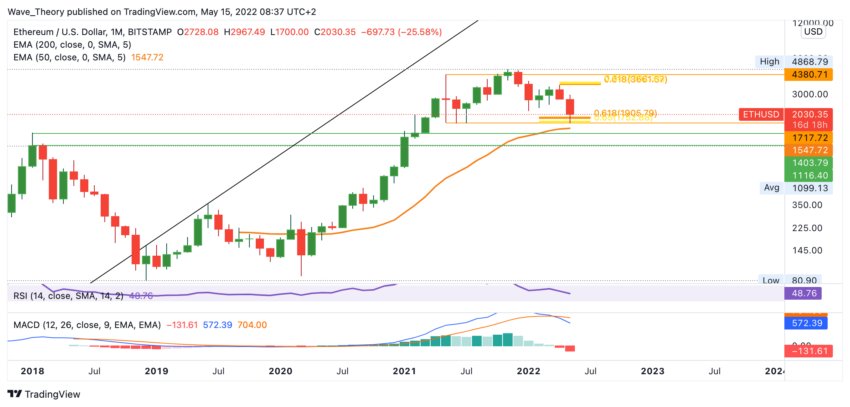
The Ethereum price reached the support zone of the Golden Ratio between the 50-month EMA at around 1,650 USD – 1,900 USD and bounced very strongly against it after it had formed a low point at 1,700 USD. Around 25% of the ETH price bounced off this support. However, the MACD is still bearish on the monthly chart. On the upside, Ethereum needs to break the Golden Ratio at around $3,700 to become bullish again and officially end the correction.
If the Golden Ratio support is broken bearishly at around 1,650 USD – 1,900 USD, Ethereum will only find support between 1,100 – 1,400 USD again, because that is where the high point from 2018 lies.
Ethereum Price Encounters Significant Fib Resistance
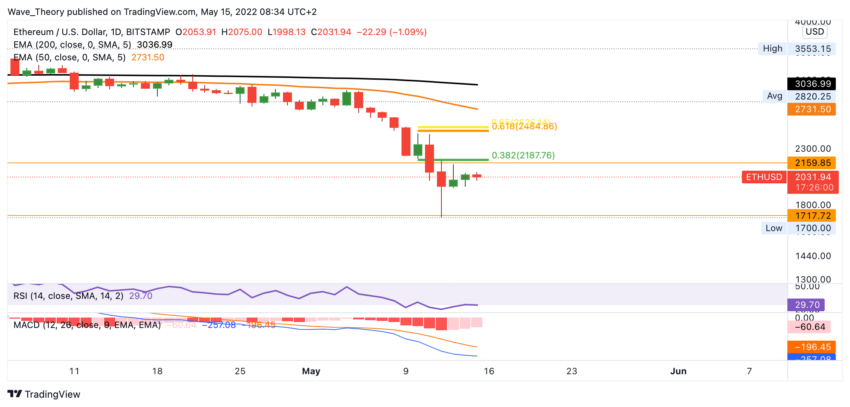
In the daily chart, the MACD’s histogram is already ticking bullish higher and the RSI is still in oversold regions. At around $ 2,200 and $ 2,500, the Ethereum price is now encountering significant Fib resistance, which must be overcome if Ethereum is to be saved from lower lows.
Regarding the EMAs, it still looks bearish on the daily chart, because the death cross is still intact.
Weekly chart is also bearish for the ETH course
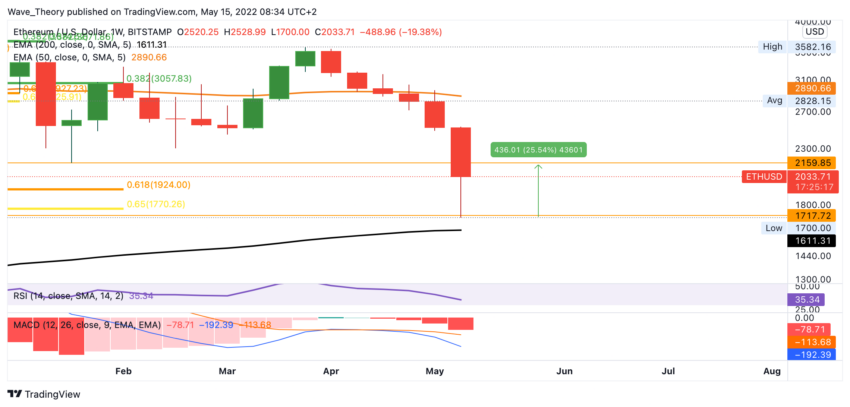
This is now the sixth week in a row in which Ethereum is lower at the end of the week than at the beginning of the week; that is, it has fallen in price. Nevertheless, there is bullish hope, provided that the support can successfully hold between $ 1,600 – $ 1,950.
With regard to the MACD, however, the weekly chart is still bearish: the histogram ticks bearishly lower and the MACD lines remain bearishly crossed. The RSI gives neither bullish nor bearish signals.
ETH price remains stable against BTC
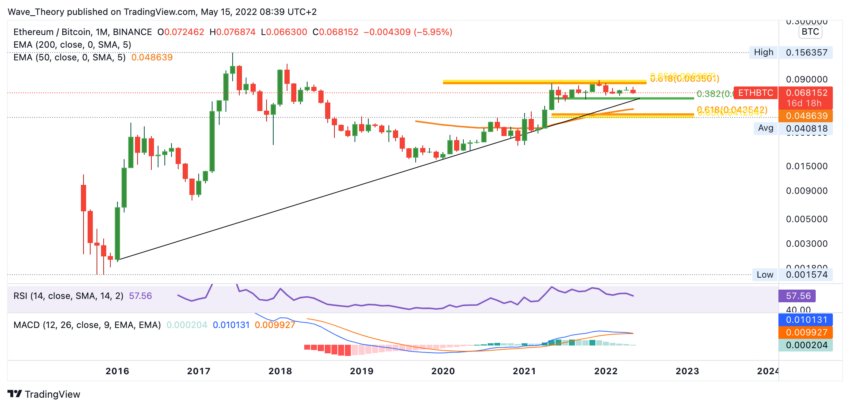
Against BTC, the Ethereum price was not exposed to much volatility. Ethereum finds strong support at the 0.382 Fib level at 0.06 BTC and then at the latest at the Golden Ratio at 0.042 BTC. At around 0.085 BTC, significant resistance awaits the ETH price at the Golden Ratio.
However, the MACD is currently developing bearishly in the monthly chart: the MACD lines are crossing bearishly and the histogram is ticking bearishly lower. However, if the support at the 0.382 Fib level can hold at 0.06 BTC, even the trend line will remain intact.
Overall, it still looks relatively good for the ETH / BTC price.
Disclaimer
All information contained on our website is researched to the best of our knowledge and belief. The journalistic articles are for general information purposes only. Any action taken by the reader on the basis of the information found on our website is done exclusively at his own risk.