
Was this the perfect entry point for the Bitcoin course?
- Analysis
- May 15, 2022
The Bitcoin price has already bounced up 22% after BTC reached the price target at around $ 26,000. Was this the perfect entry point?
In the last Bitcoin price forecast of May 06, 2022, we wrote:
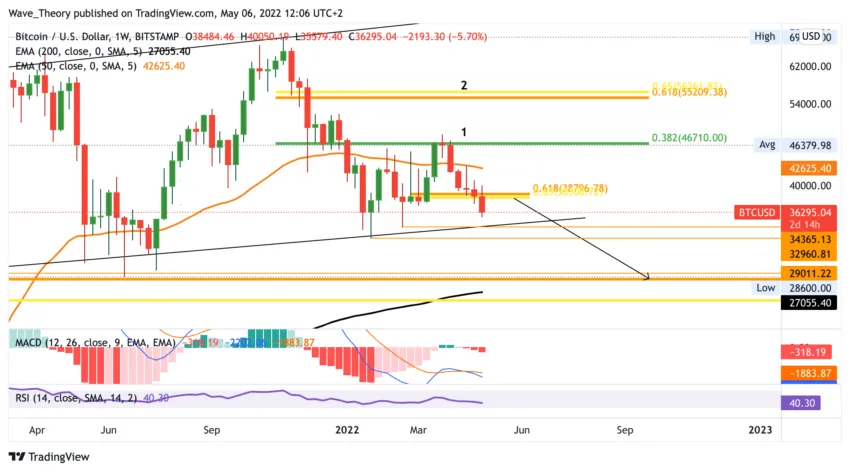
“[Der] Bitcoin price could now correct between 26,000 – 29,000 USD. With the break of the Golden Ratio at around $ 39,000, a decline to the golden ratio between $ 26,000 – $ 29,000 is getting closer and closer.”
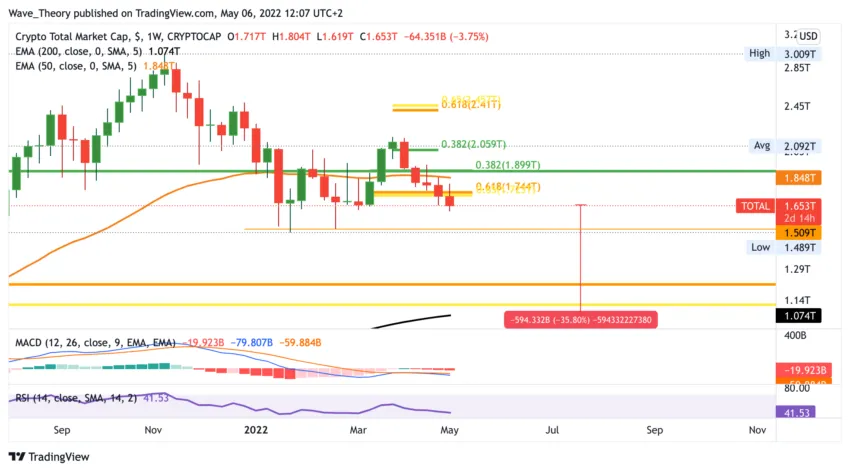
“The crypto market could now fall around 35%. The crypto market has also now broken through the Golden Ratio support. If it does not bounce successfully at the next support at around 1.5 B USD, it could correct to the golden ratio at around 1.2 B USD, which implies a price decline of around 36%. Here, too, the indicators are bearish, which means that the bearish scenario is currently more likely than a bullish U-turn.”
Bitcoin price Rises around 22% after Picking up the price target
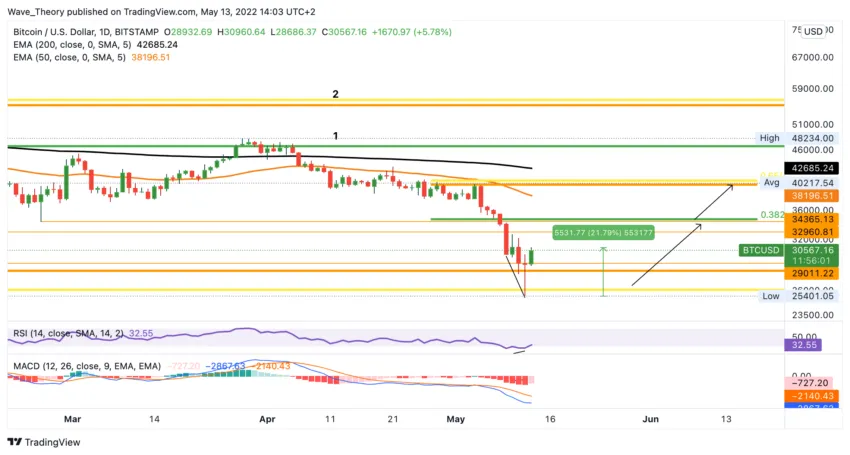
The Bitcoin price formed a low point at $ 25,401 and then rose about 22%. Thus, the BTC price has bounced very strongly against the Golden Ratio support so far and if Bitcoin continues its upward movement, it could even record an increase of around 30% or even 50%.
While the RSI is currently neutral, the EMAs and MACD lines are still bearishly crossed. The histogram, on the other hand, is already ticking bullish higher today.
Bitcoin price could rise to around $35,000 or even $40,000
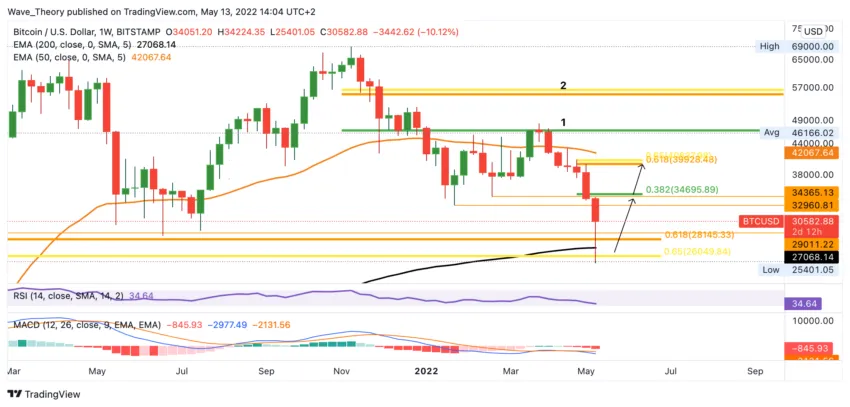
The Bitcoin price could now rise to around $ 35,000 or even around $ 40,000, because that’s where Bitcoin meets the next Fibonacci resistance. If Bitcoin is not rejected bearishly at these resistances, Bitcoin could have already reached its bottom. On the weekly chart, however, the RSI is still neutral, while the histogram gives bearish signals.
Has the bottom for Bitcoin already been reached?
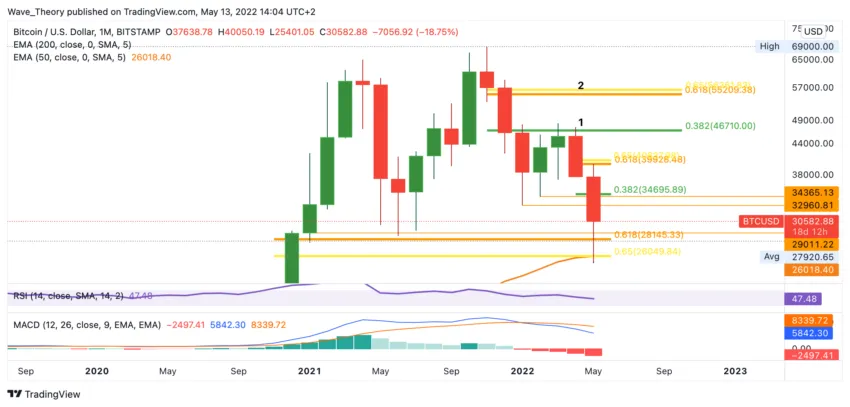
Bitcoin bounced exactly at the price target, which is a very bullish sign. Finally, between 26,000 – 29,000 USD is the most important and largest support for the BTC price. If this is breached bearishly, Bitcoin could correct up to around 19,000 – 22,000 USD. So if Bitcoin breaks through the Fibonacci resistances at $ 35,000 and $ 40,000 bullish, the chances are good that Bitcoin has reached its bottom and there will be a bull market again soon.
Then the price target at around $ 26,000 could have been the perfect entry point for the BTC price this cycle.
The crypto market followed the forecast and corrected exactly around 36 %
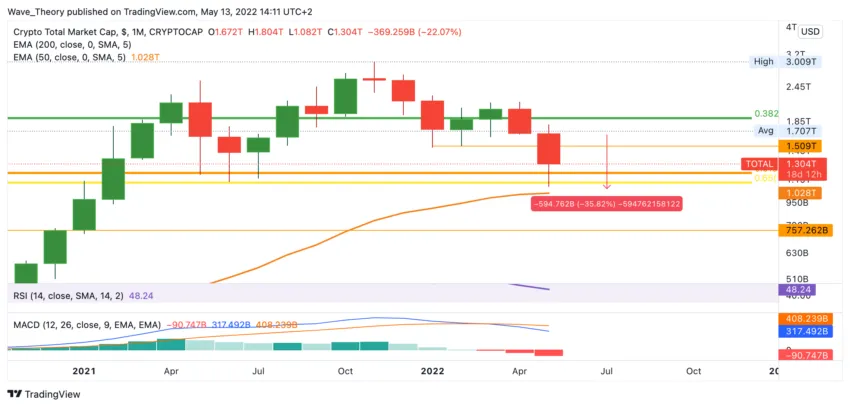
The crypto market followed exactly the forecast of May 06 and corrected around 36% to bounce off the Golden Ratio support at around $ 1.2 B. Despite the rebound, the indicators are not yet bullish, instead the MACD lines remain bearishly crossed and the histogram ticks bearishly lower.
Disclaimer
All information contained on our website is researched to the best of our knowledge and belief. The journalistic articles are for general information purposes only. Any action taken by the reader on the basis of the information found on our website is done exclusively at his own risk.