
Bitcoin price could now fall to $20,000
- Analysis
- May 16, 2022
The Bitcoin price is in danger of correcting to around $ 20,000 if BTC breaks the golden Ratio between $ 26,000 – $ 29,000.
“Bitcoin bounced exactly at the price target, which is a very bullish sign. Finally, between 26,000 – 29,000 USD is the most important and largest support for the BTC price. If this is breached bearishly, Bitcoin could correct up to around 19,000 – 22,000 USD.“
Bitcoin price bounces around 24% and is then rejected bearishly
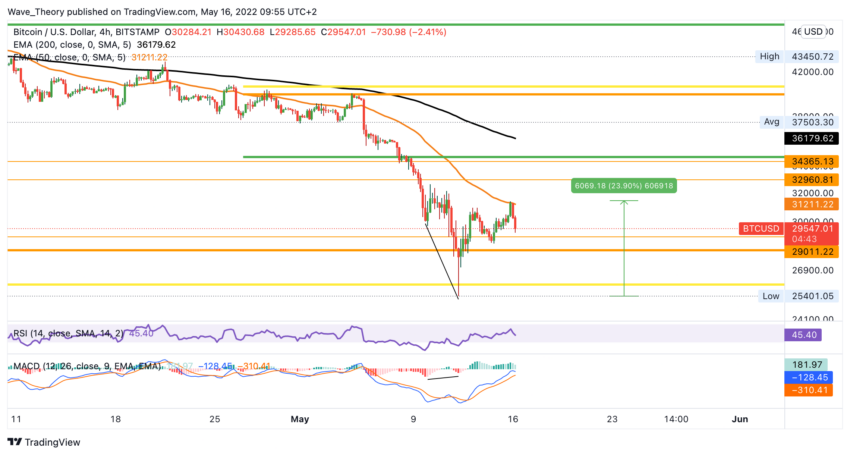
So far, the Bitcoin price has been able to bounce strongly on the Golden Ratio support between 26,000 – 29,000 USD. Overall, the BTC price has already recorded a price increase of around 24% since BTC established a low point at $ 25,401. However, BTC has now been rejected at around $31,200 on the 50-4H EMA, after which Bitcoin could return to support between $26,000 – $29,000.
Is the Bitcoin price falling to around $ 20,000?
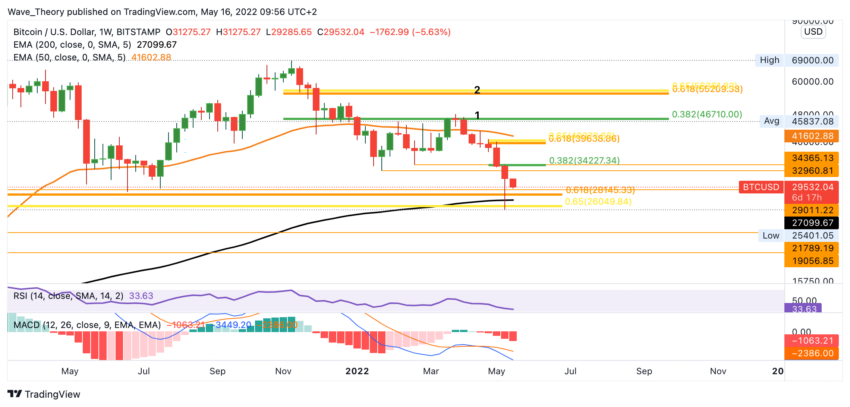
If this is broken bearishly, Bitcoin will only find significant support again between 19,000 – 22,000 USD. This week is especially important for the Bitcoin price, because if this week goes bearish, the chance increases significantly that Bitcoin breaks the Golden Ratio support between 26.000 – 29.000 USD. On the other hand, if Bitcoin rises sharply this week, it could target the Fibonacci resistances at around $34,000 and $40,000. However, the weekly MACD is still clearly bearish and the RSI is also not giving bullish signals.
The daily chart is more bullish
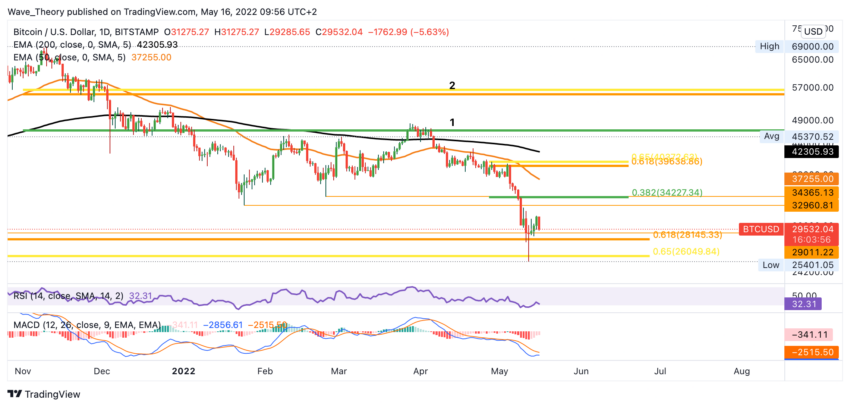
In the daily chart, however, the MACD is already much more bullish, because the histogram has been ticking bullish higher there for a few days and the MACD lines could soon cross bullish. The RSI, on the other hand, is neutral. The EMAs are also still bearishly crossed, which means that the trend remains bearishly confirmed in the medium term.
However, for BTC’s trend to become bullish again, Bitcoin must first overcome the Fibonacci resistances at around $ 42,000 and $ 53,000. Until then, Bitcoin remains in a correction phase.
Is the bear market over soon?

One can only guess how long the bear market will last. In total, the bear market has been going on for 181 days now. However, this is still relatively short, because the last two bear markets were 266 and 371 days for the BTC price.
Crypto Market Encounters Strong Support

For the crypto market in general, it looks very similar. The crypto market is currently finding very strong support at the 1 B USD mark, because that is where the 50-month EMA meets the important Golden Ratio support. But here, too, it becomes clear that the bear market could drag on a little longer. In addition, the MACD is clearly bearish on the monthly chart, while the RSI does not give bullish signals. If the market capitalization of the crypto market falls below 1 B USD, the crypto market could correct between 400 – 760 billion USD.
Disclaimer
All information contained on our website is researched to the best of our knowledge and belief. The journalistic articles are for general information purposes only. Any action taken by the reader on the basis of the information found on our website is done exclusively at his own risk.